
Did you know? Climate change could be intensifying.
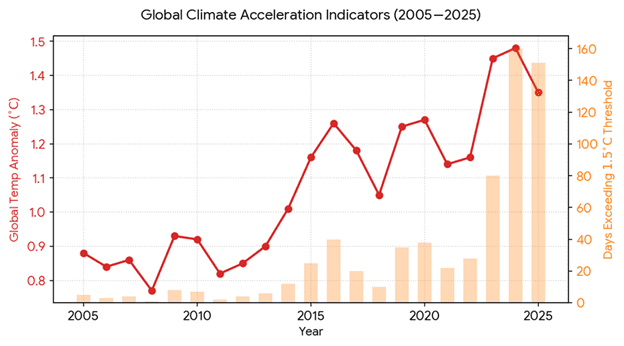
Did you know? Climate change could be intensifying. Here is a plot of Global Temperature anomalies and frequency. Source: NASA Goddard Institute for Space Studies & Copernicus Climate Change Service. (2026). Global Climate Acceleration Indicators (2005–2025). Charted via AI Assistant Workspace using historical temperature anomaly datasets. Retrieved May 15, 2026.
- The red line demonstrates a steady upward trend in global surface temperatures, culminating in record-breaking spikes between 2023 and 2025. The actual temperature anomalies are verified by NASA and the European Union’s Copernicus Service
- The orange bars reveal extreme heat day trends, highlighting the non-linear erratic nature of climate change. The number of days globally that break severe climate thresholds (such as the 1.5 °C threshold) has expanded rapidly from single digits in the mid-2000s to over 150 days per year by 2024–2025. Thresholds are defined by the World Meteorological Organization’s ETCCDI framework
- The electrification of industrial heating equipment offers one of the lowest costs per kW, making it a highly cost-effective strategy to reduce global GHG emissions.
- To learn more about erratic thunderstorms and typical cloud formations as they relate to the climate change and global temperature increase please click here. Yes glaciers will melt when this is ongoing.










 MHI Inc. USA
 MHI Inc. USA